The Challenge of Market Share Reporting
The Analysis
| The T2RL database of airlines and their software providers located at www.t2rl.net is a unique resource. Its aim is to list all of the world's passenger airlines whatever their location, business model or membership of any particular grouping or association. As a result it is more comprehensive than any comparable listing and it is possible to use it to determine market shares for software service providers with a high degree of accuracy. However there are pitfalls to any attempt to measure market shares, which mean that it is very important to understand exactly what is being described in the market share reports. This document will set out in some detail the approach to market share measurement in the database. |
 |
1. Passenger Numbers
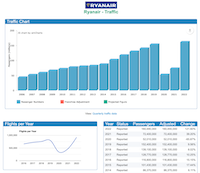 |
The majority of commercial airline IT services are sold on the basis of passenger numbers. The metric may be the number of passengers boarded or passengers booked, the former usually being somewhat greater than the latter because of overbooking practices at many airlines. By far the most significant software service is the Passenger Services System (PSS), which includes reservations, inventory, fare quote, ticketing and departure control. Most airlines buy a complete PSS suite from a single vendor but a significant minority split their provision between vendors. Internet Booking Engines, or e-commerce suites, are also often considered part of the PSS but these are commonly sourced from vendors other than the main PSS supplier. In the T2RL database we record the passenger numbers reported by the airlines in regulatory filings, annual reports or press releases. In general we are able to update numbers for carriers based in the United States very quickly because that country has mandatory public filing of airline information. In other regions only publicly-quoted companies make detailed reports available but many others choose to release data, either directly or via regional airline associations. Some smaller airlines make no public report of their passenger numbers and in these cases we make an estimate based on a model of activity taking into account the composition of the fleet, the route network and the business model of the airline. In a typical year between 90% and 95% of the passenger numbers in the database are reported by the airlines with the remainder estimated. More information on Bookings, Segments, PAX, PBs, Tickets and PNR |
2. Franchise Adjustments and Adjusted Passenger Numbers
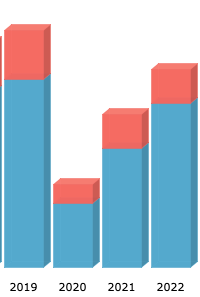
| In some markets, particularly the United States, it is common for large airlines to contract out the flying on some of their routes to specialist regional carriers. These airlines operate under the identity of the large parent airline despite having their own AOC and their own aircraft and staff. When it comes to the commercial IT systems such as reservations and check-in these regional airlines do not purchase services on their own behalf, rather they use the systems of their large-airline partners. We refer to these airlines as franchised carriers and in determining the market penetration of the various IT vendors we go through a process of reallocating their passenger numbers to their partners. This is sometimes a simple process with all the passengers carried by a franchise airline being allocated to the same partner. On the other hand there are some regional airlines that operate on behalf of multiple partners. In these cases we use the airlines' annual reports and regulatory filings to determine the correct split and we allocate their passengers to the partner airlines in the correct proportions. These figures we refer to as Adjusted Passengers. |
 |
3. The Use of Products
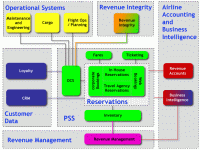 |
Most of the PSS vendors have a base charge per passenger that is paid for every passenger booked or boarded by the airlines. This typically covers the use of the core PSS products reservations, inventory, ticketing and DCS. Other products such as fare quote and Internet Booking Engines are only charged on the basis of passengers processed using those products. Thus for example out of a total market of 3 Billion passengers boarded in 2011 around 860 million were booked online by the airlines' IBEs. This means that the total market for core products was 3 Billion while for IBEs it was 860 million. Fare quote services are generally used for bookings made directly with the airline whether online or offline so the total market size for fare quotes includes bookings made in airline ticket offices and call centres as well as Web sites. |
4. Timing
The most challenging aspect of determining market shares is the timing of airline moves between suppliers. The T2RL database reports give headline market share numbers as a current snapshot.
The effect of this may be seen when an airline switches vendors during the most recent year. The database reports will allocate the whole year's passenger numbers to the new vendor which will inflate its share for the year and deflate that of the previous vendor. It is also important to note that allocations are switched in the database at the time of implementation, not at the time of contract signature. This sometimes causes discrepancies with vendor claims. They often count contracted numbers rather than implemented ones. |
|

